Enterprise Software · 2022

Event Gamification Platform

A dual-portal gamification platform that turned corporate event attendance into a competition — 12,000+ active users.

Frontend lead + backend support — B2B
Event gamification — admin
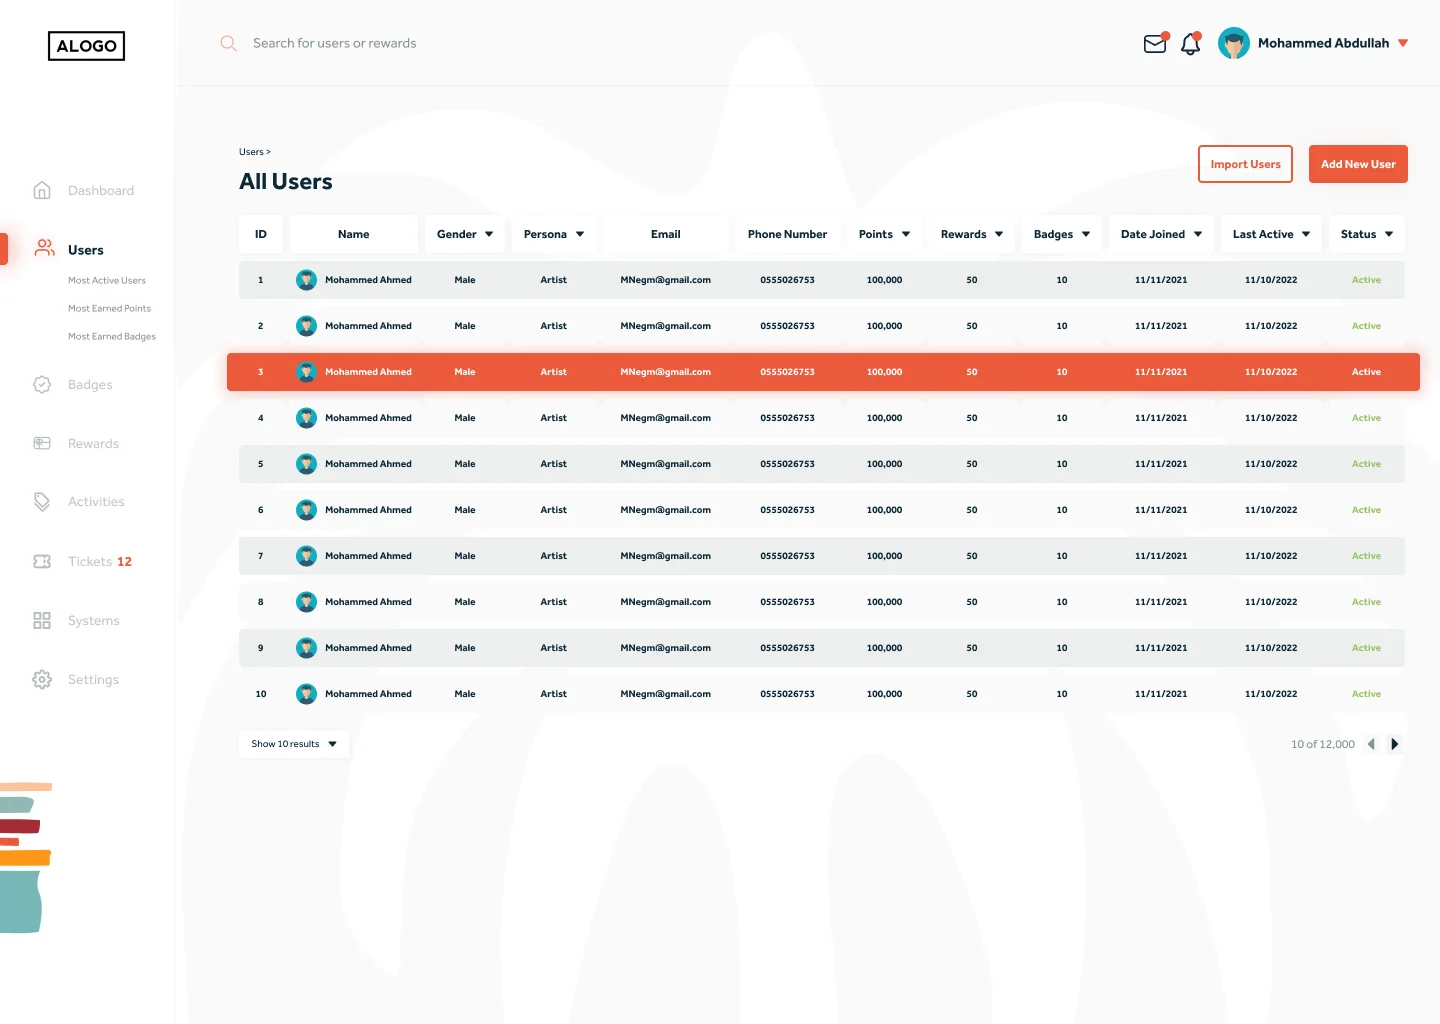
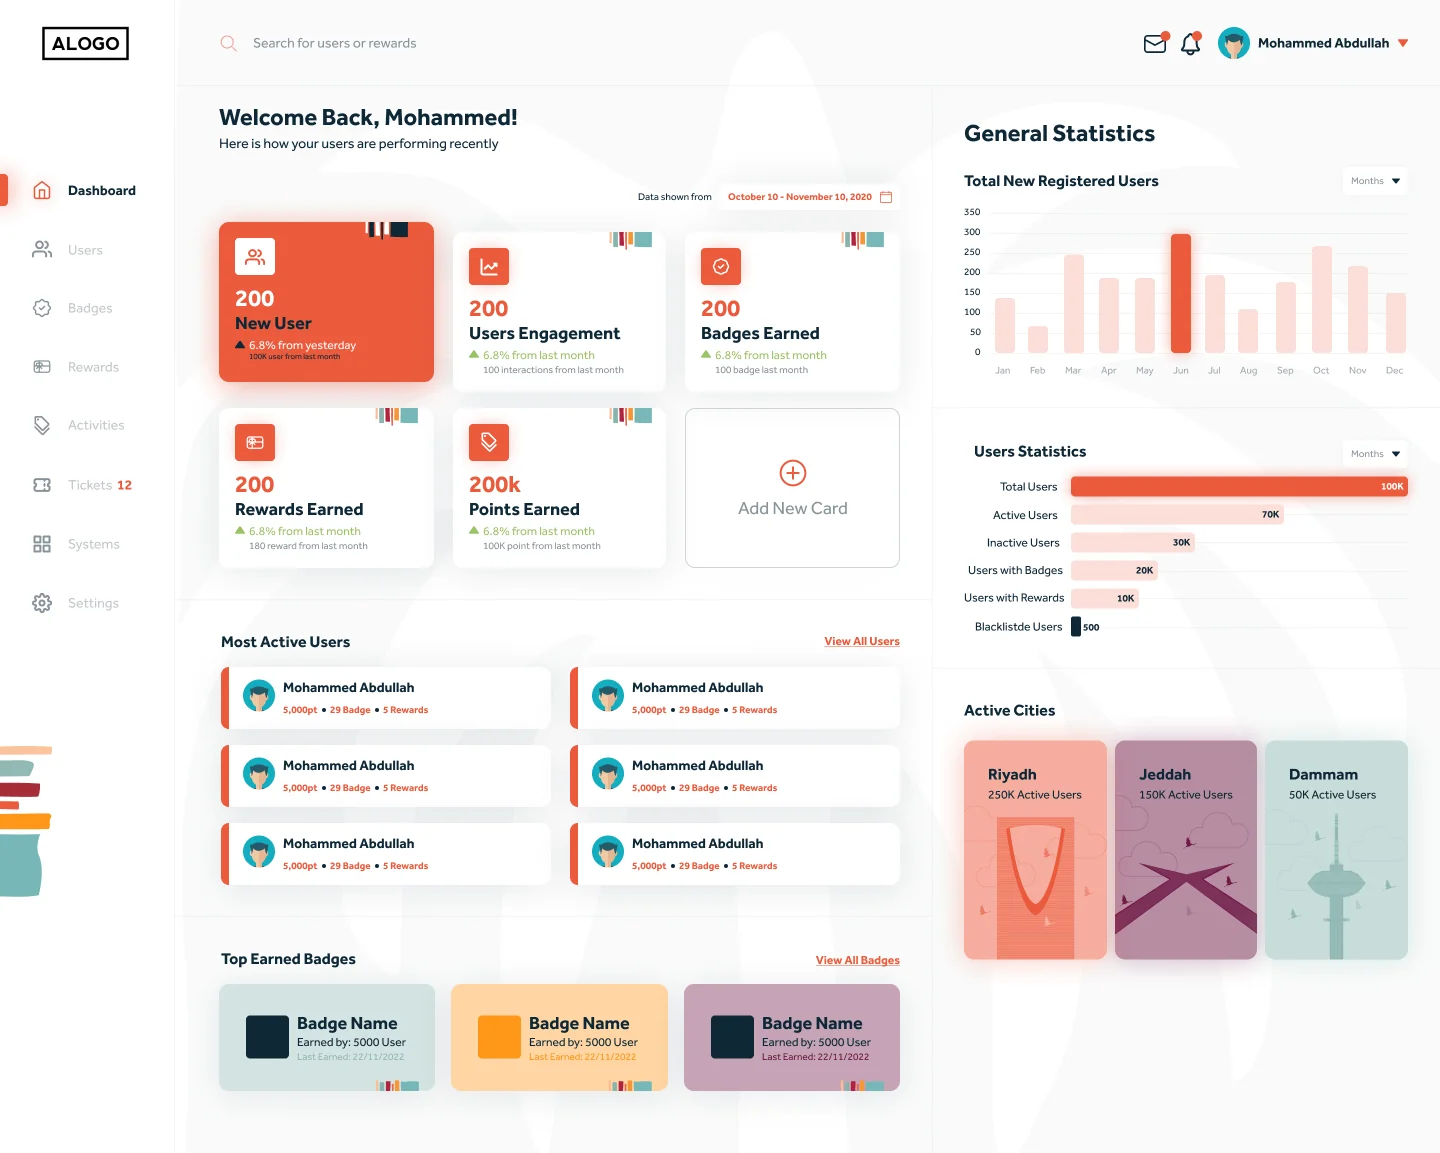
Event gamification platform admin dashboard
Scroll — full dossier below
01Context

A Saudi IT company’s client needed attendance and engagement at organizational events to stop being a compliance exercise. The answer: points, badges, tiers, leaderboards, and tangible rewards — an incentive economy layered on top of event participation.

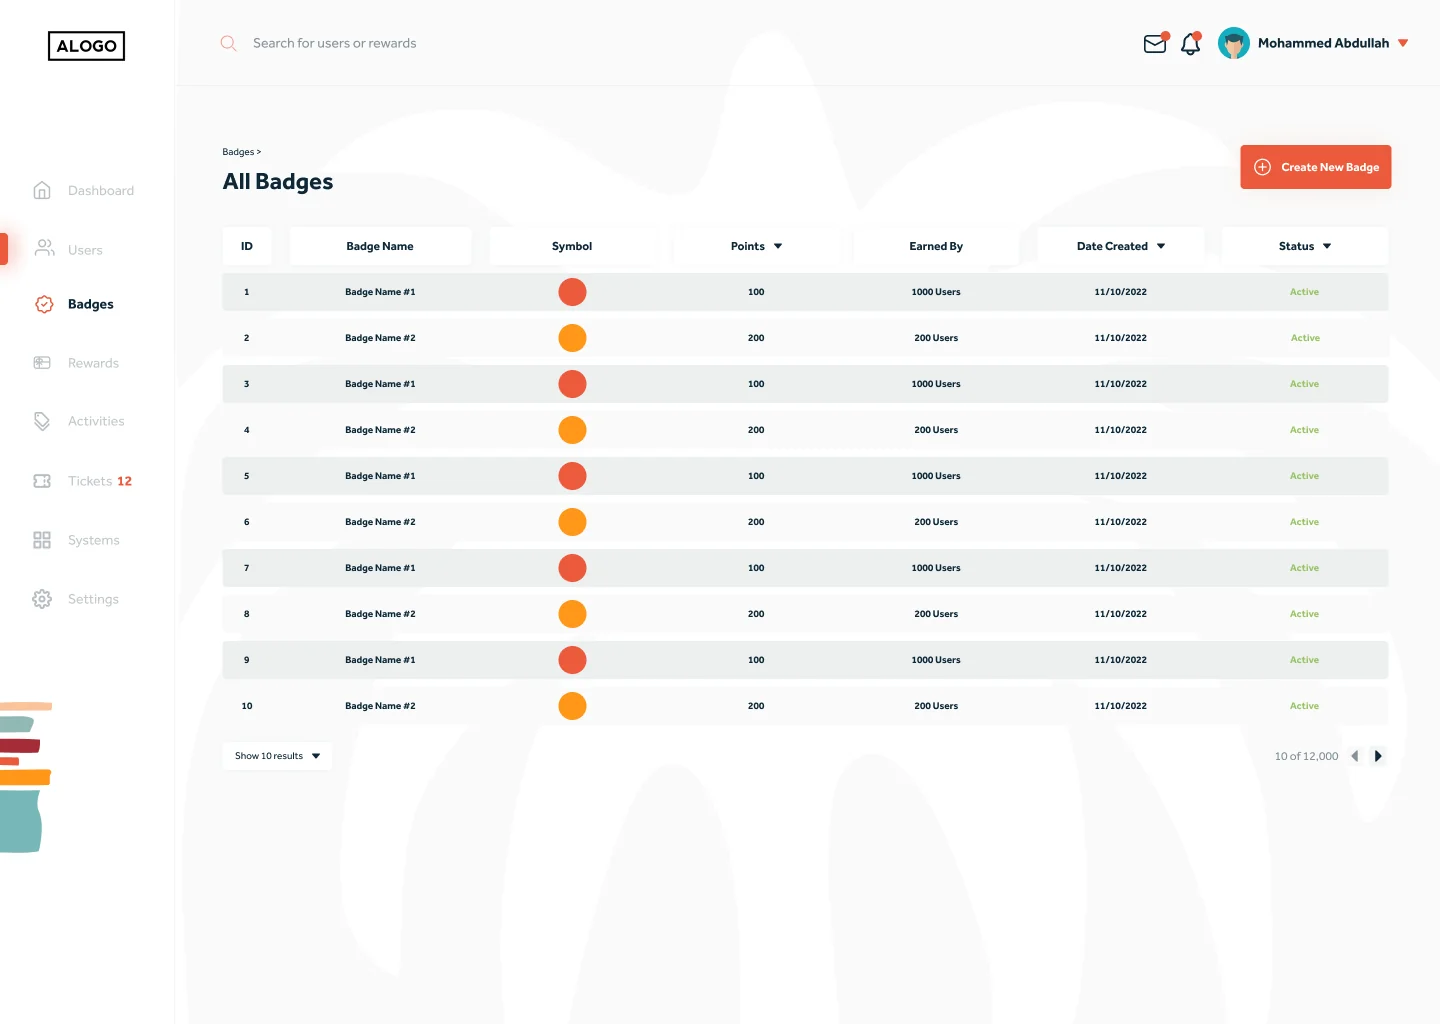
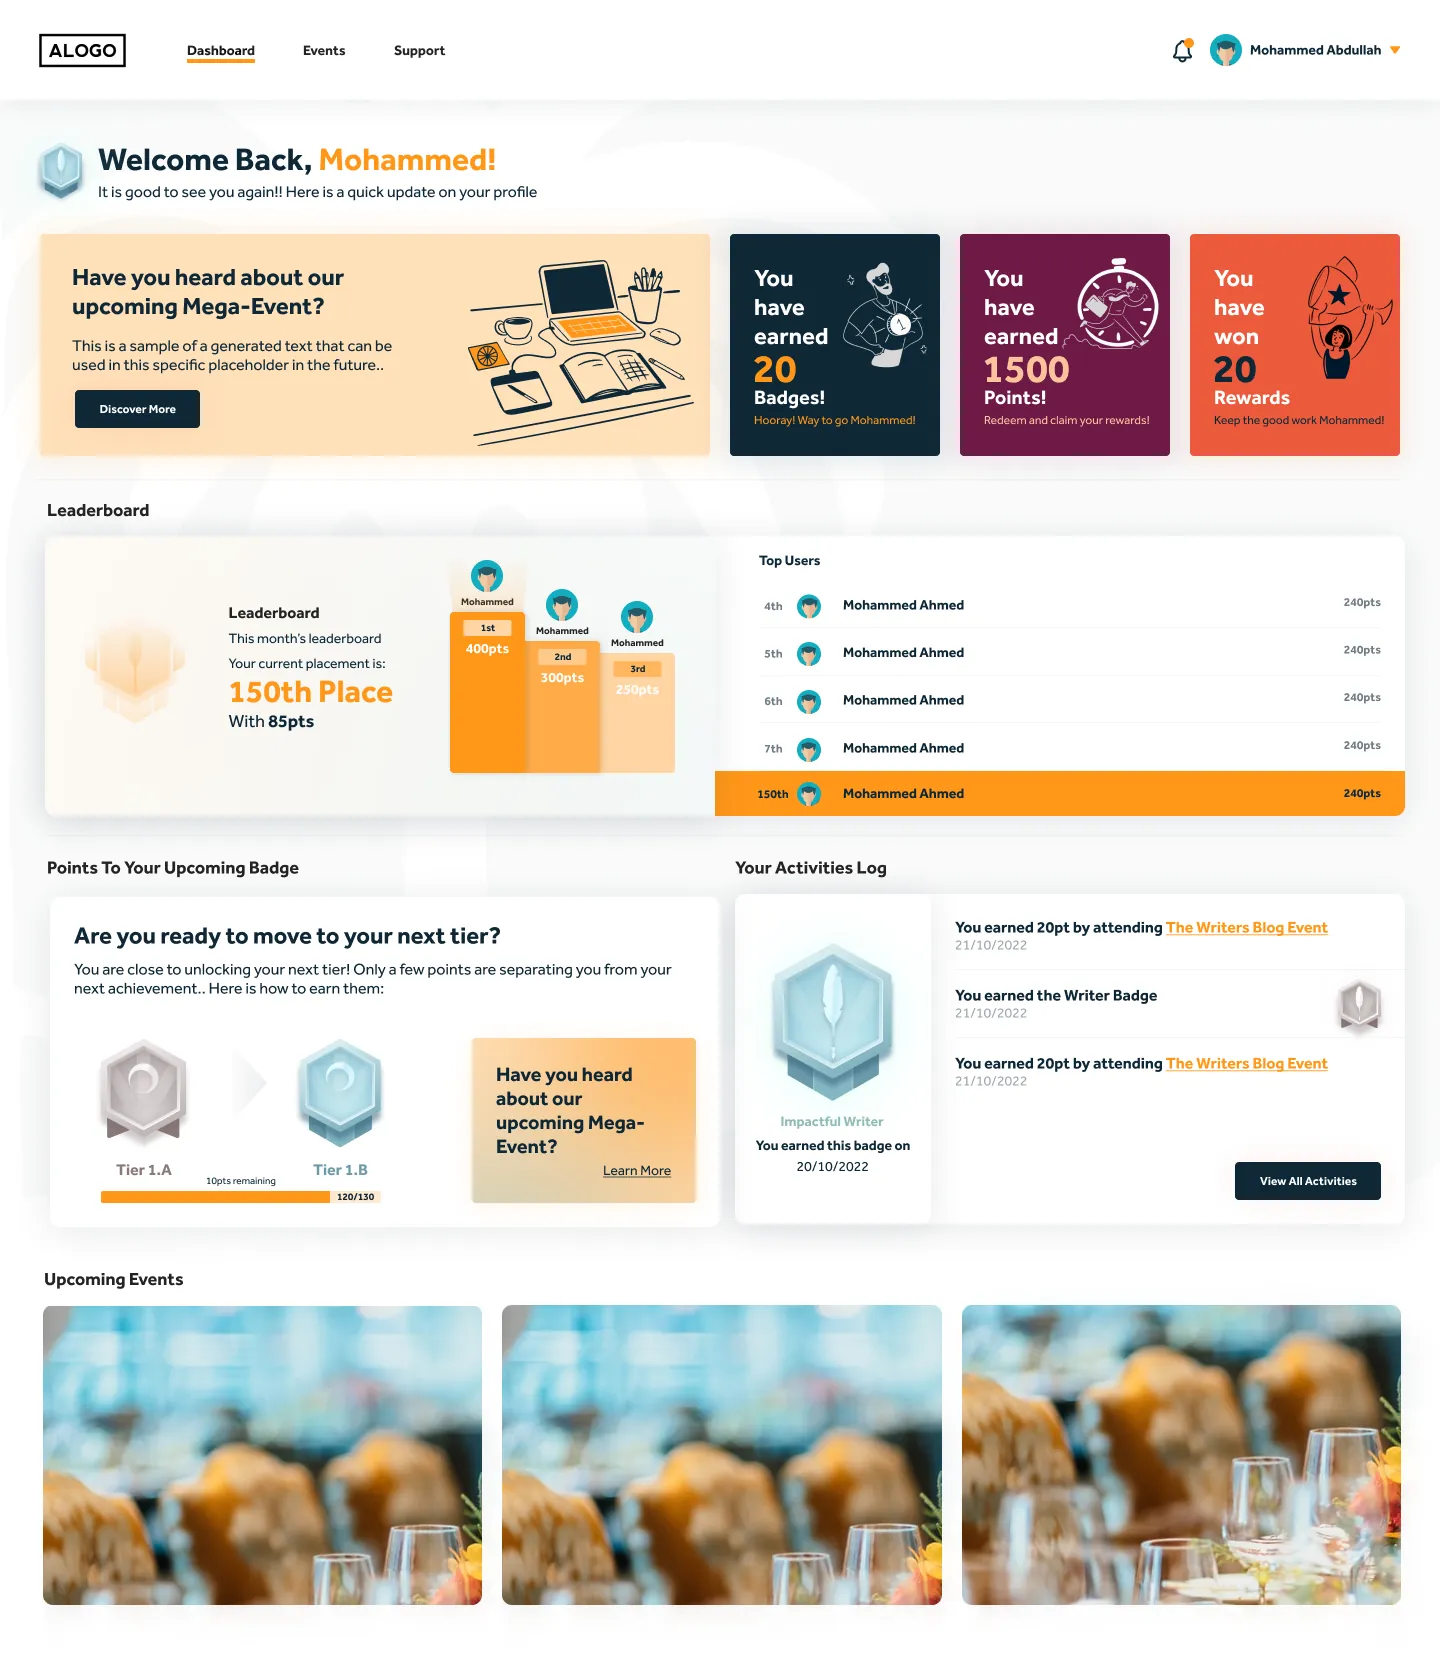
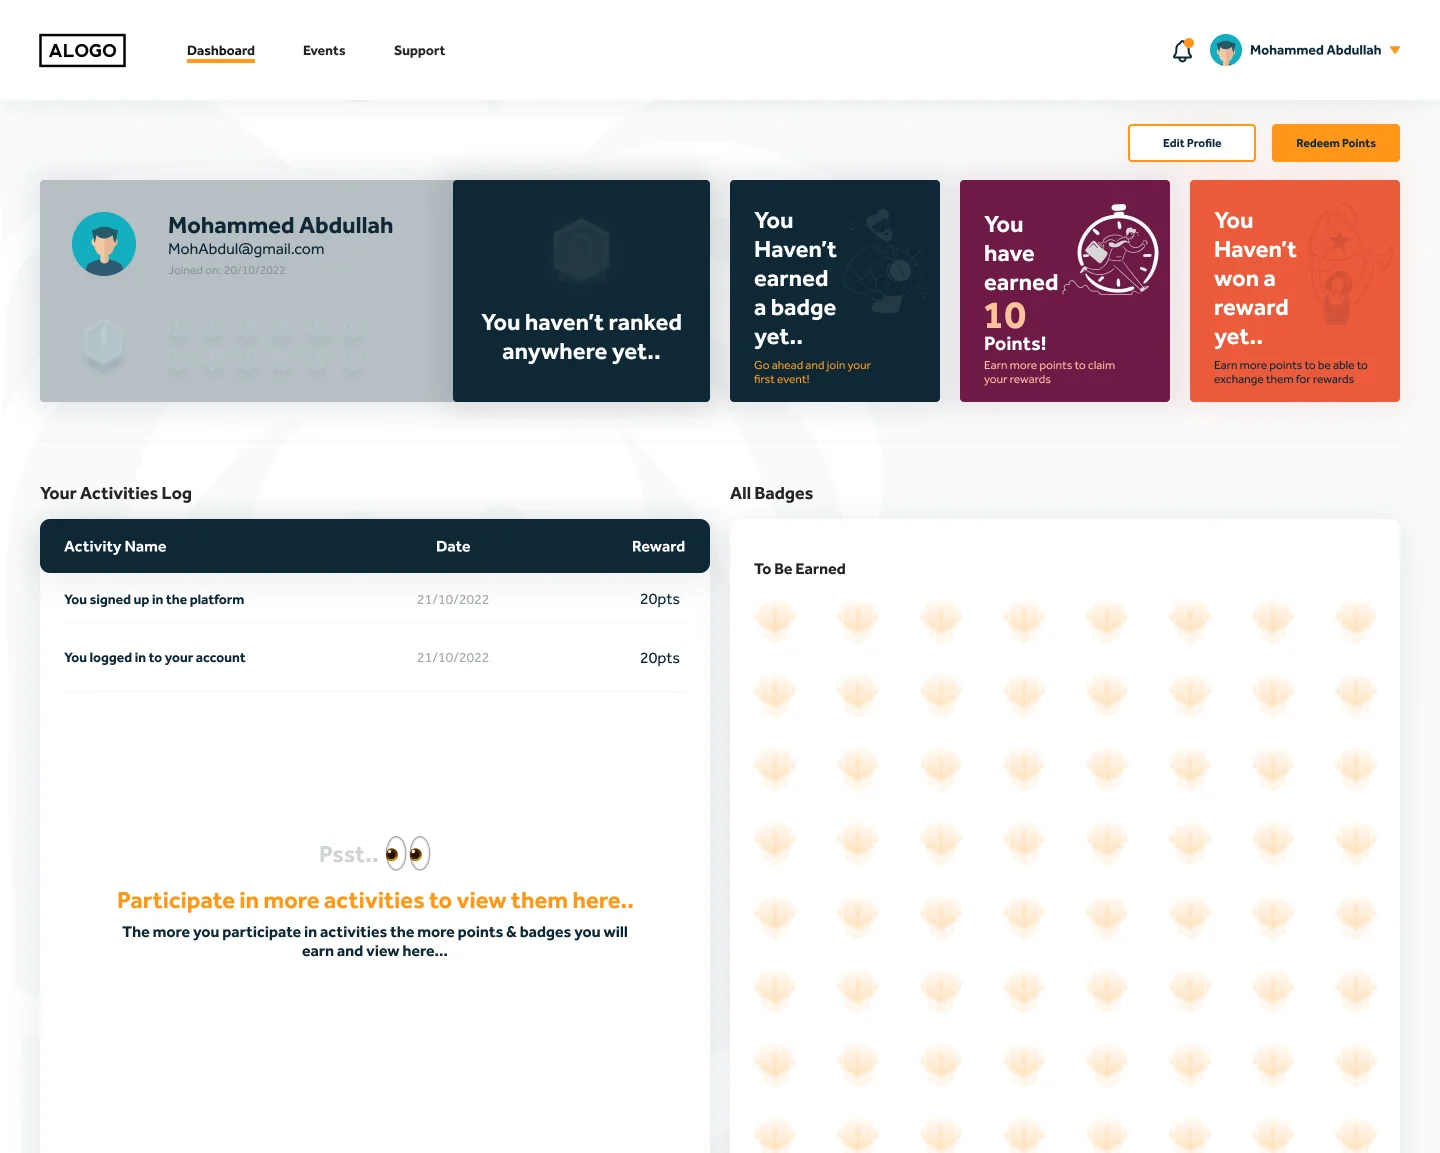
The platform is two products sharing one system: an admin dashboard where organizers design activities, badge systems, and reward catalogues; and a participant portal where employees track achievements, compete on leaderboards, and redeem rewards. I led the frontend across both portals — 50+ screens from Figma — and stepped into the backend to help the team hit the launch date.

02Constraints
Two portals, one system
Admin dashboard + participant portal, coherent UI
50+ screens
Pixel fidelity to Figma on a tight deadline
Team delivery
Frontend lead alongside 3–4 backend developers + a designer
Data-heavy admin
Tables, charts, and CSV imports at 90+ Lighthouse
03System design
FIG. 01 — DUAL-PORTAL ARCHITECTURE
RESTRESTlive ranksimportAdmin PortalorganizersUser PortalparticipantsNode/Express APISocket.IOlive leaderboardsMongoDBCSV Pipelinebulk user import
04Key decisions

One shared component system across both portals

over: Two independent frontends

Admin tables and participant-facing gamification UI look nothing alike in Figma, but underneath they share forms, modals, charts, and list machinery. One system meant every fix landed in both portals — and the two products stayed visually coherent where it mattered.

Virtualized, memoized admin tables

over: Plain mapped rows

The admin dashboard renders thousands of users with live stats; naive rendering choked. Row virtualization and aggressive memoization held 90+ Lighthouse scores — at the cost of stricter state design, since a memoized row must never show a stale rank.

Stepping into the backend near the deadline

over: Staying strictly in-lane

With API endpoints lagging behind the frontend, I picked up backend tickets (Node/Express) to unblock my own screens. It cost real frontend velocity for two weeks; the launch shipped on time.

05User flow
FIG. 02 — THE INCENTIVE LOOP
Organizer
  1. 01

    Create event

    Type, date, city

  2. 02

    Define activities

    Point-earning actions

  3. 03

    Design badges

    Thresholds + tiers

  4. 04

    Stock rewards

    Redemption catalogue

  5. 05

    Track analytics

    Engagement dashboards

Participant
  1. 01

    Join event

    Browse + filter

  2. 02

    Earn points

    Complete activities

  3. 03

    Unlock badges

    Tier progression

  4. 04

    Climb leaderboard

    Live ranking

  5. 05

    Redeem rewards

    Points → products

06The hard problem

Live leaderboards that don’t melt the render tree

Leaderboards updated in real time during events: streams of rank changes flowing through Socket.IO while participants watched their own position. Re-rendering the whole board on every message made rank animations stutter exactly when the most people were looking.

I moved socket handling out of component state into a store that batches updates per animation frame, diffed incoming ranks against the visible slice, and re-rendered only rows whose position actually changed — with transform-based animations for reordering instead of layout thrash.

During live events the board stayed smooth on conference-hall wifi and mid-range phones. The platform now serves 12,000+ active users across multiple events, with zero critical frontend bugs reported after launch.
07Impact
12,000+
active users across events
50+
screens across two portals
90+
Lighthouse performance, both portals
0
critical frontend bugs post-launch
08Figures
FIG. 03 — ADMIN DASHBOARD
FIG. 03 — ADMIN DASHBOARDReal-time statistics and engagement visualizations.
FIG. 04 — ACTIVITY MANAGEMENT
FIG. 04 — ACTIVITY MANAGEMENTPoint-earning activities tied to specific events.
FIG. 05 — BADGE SYSTEM
FIG. 05 — BADGE SYSTEMCustom badges with thresholds and tier progression.
FIG. 06 — PARTICIPANT DASHBOARD
FIG. 06 — PARTICIPANT DASHBOARDPersonal rank, badges, points, and rewards.
FIG. 07 — LEADERBOARD
FIG. 07 — LEADERBOARDLive ranking — the screen everyone watched during events.