Security Analytics · 2023

BlueVoyant— M365 Security Analytics

Self-service M365 security analytics where customer data never leaves the browser — private by architecture, not by policy.

Full stack — freelance, direct with client
Secure Score analytics
BlueVoyant M365 Secure Score analytics dashboard
Scroll — full dossier below
01Context

BlueVoyant, a Microsoft-partner cybersecurity company, needed to give enterprise clients self-service analysis of their Microsoft 365 Secure Score exports. The blocker was trust: no security team wants to upload raw security-posture data — effectively a map of every misconfiguration in their tenant — to a third party’s servers.

The answer was architectural. The CSV is parsed and analyzed entirely in the client’s browser; the backend performs stateless calculations on derived structures and stores nothing. I designed and built the platform end-to-end across three phased engagements, collaborating directly with the BlueVoyant team.

02Constraints
Zero persistence
Sensitive files must never touch a server — non-negotiable
Non-technical users
Security analysts and executives, not developers
Short phases
Three one-month engagements, each shipping something usable
Microsoft semantics
Scoring and color language had to match the M365 console exactly
03System design
FIG. 01 — PRIVACY-FIRST DATA FLOW
derived dataaggregates onlySecure Score CSVclient fileBrowser Parsein-memory onlyAnalytics UID3 + Chart.jsNode APIstateless calculationsNo file storage. No data at rest. By design.
04Key decisions

Client-side processing

over: Conventional upload-and-process backend

Uploading would have simplified compute and kept the logic server-side — and killed the deal. Keeping parsing in the browser meant wrestling with main-thread limits on large CSVs, but it turned the privacy promise into a property of the architecture instead of a line in a policy document.

Match Microsoft’s scoring semantics exactly

over: A custom scoring presentation

Analysts live in the M365 console; a different color language would erode trust in every number. The cost: handling Microsoft’s inconsistent export data — empty rows, missing color codes — with explicit, documented exclusion rules rather than silent guesses.

05User flow
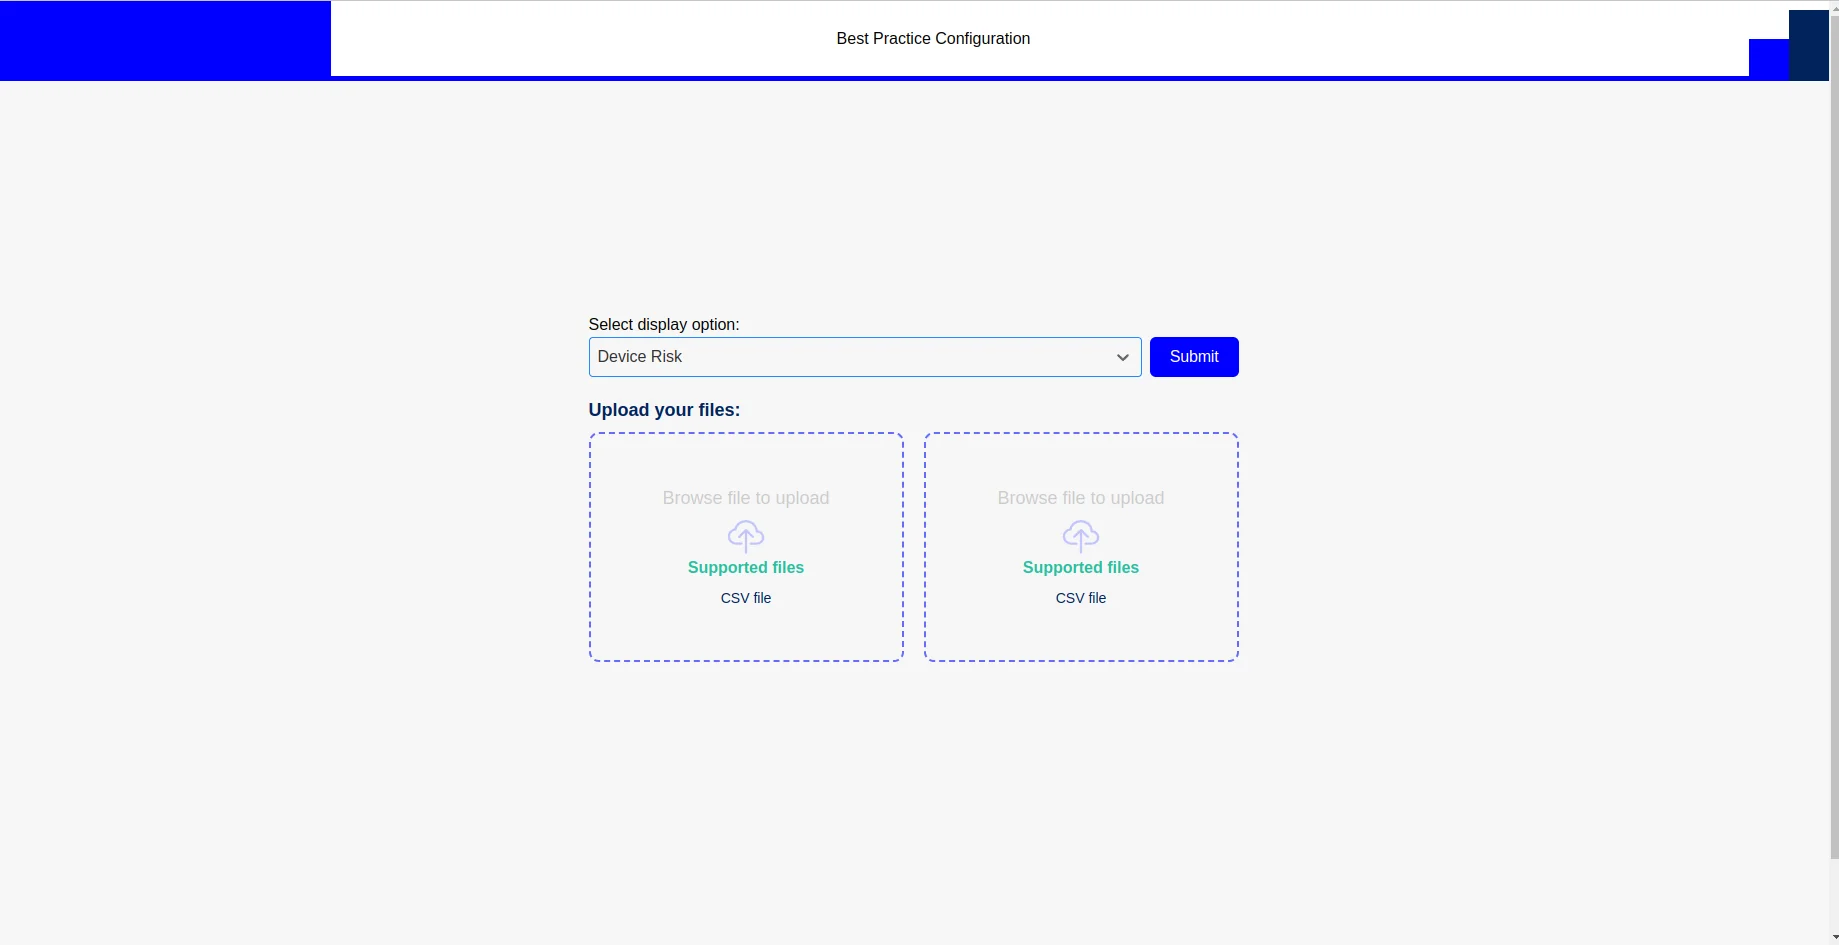
FIG. 02 — ANALYSIS FLOW
  1. 01

    Export CSV

    From the M365 admin center

  2. 02

    Drop in browser

    File never uploaded

  3. 03

    Client-side parse

    Chunked, off the hot path

  4. 04

    Analyze

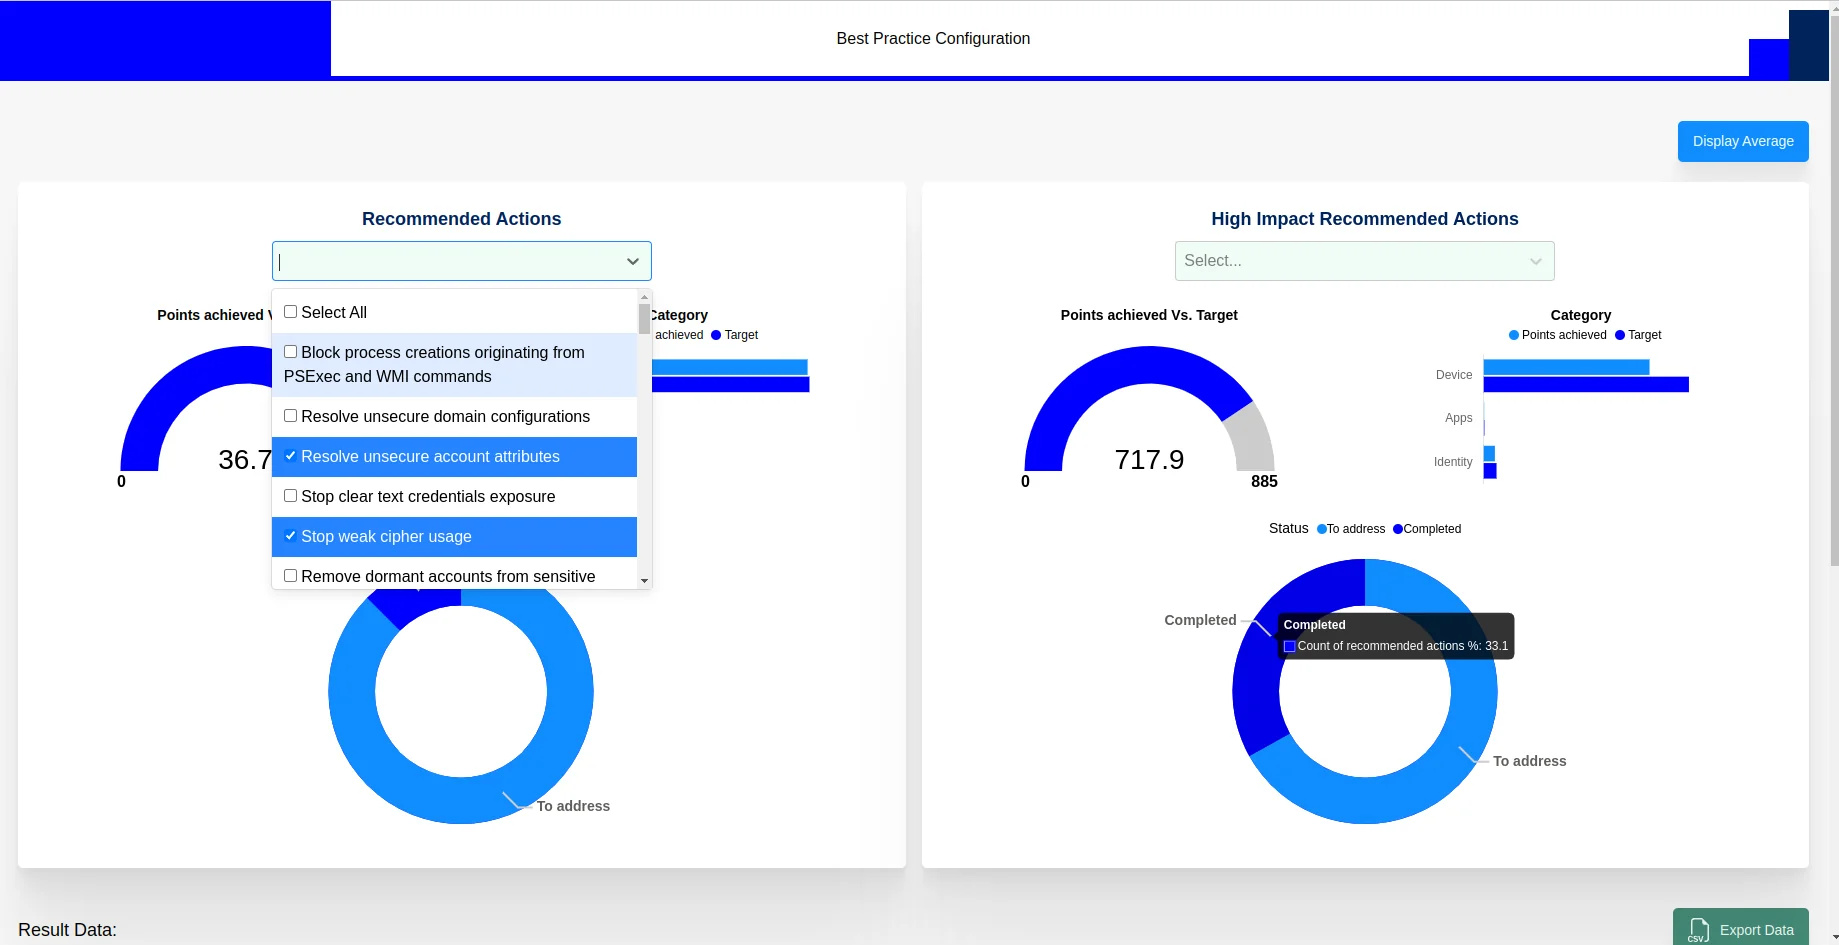
    Recommended vs high-impact actions

  5. 05

    Filter

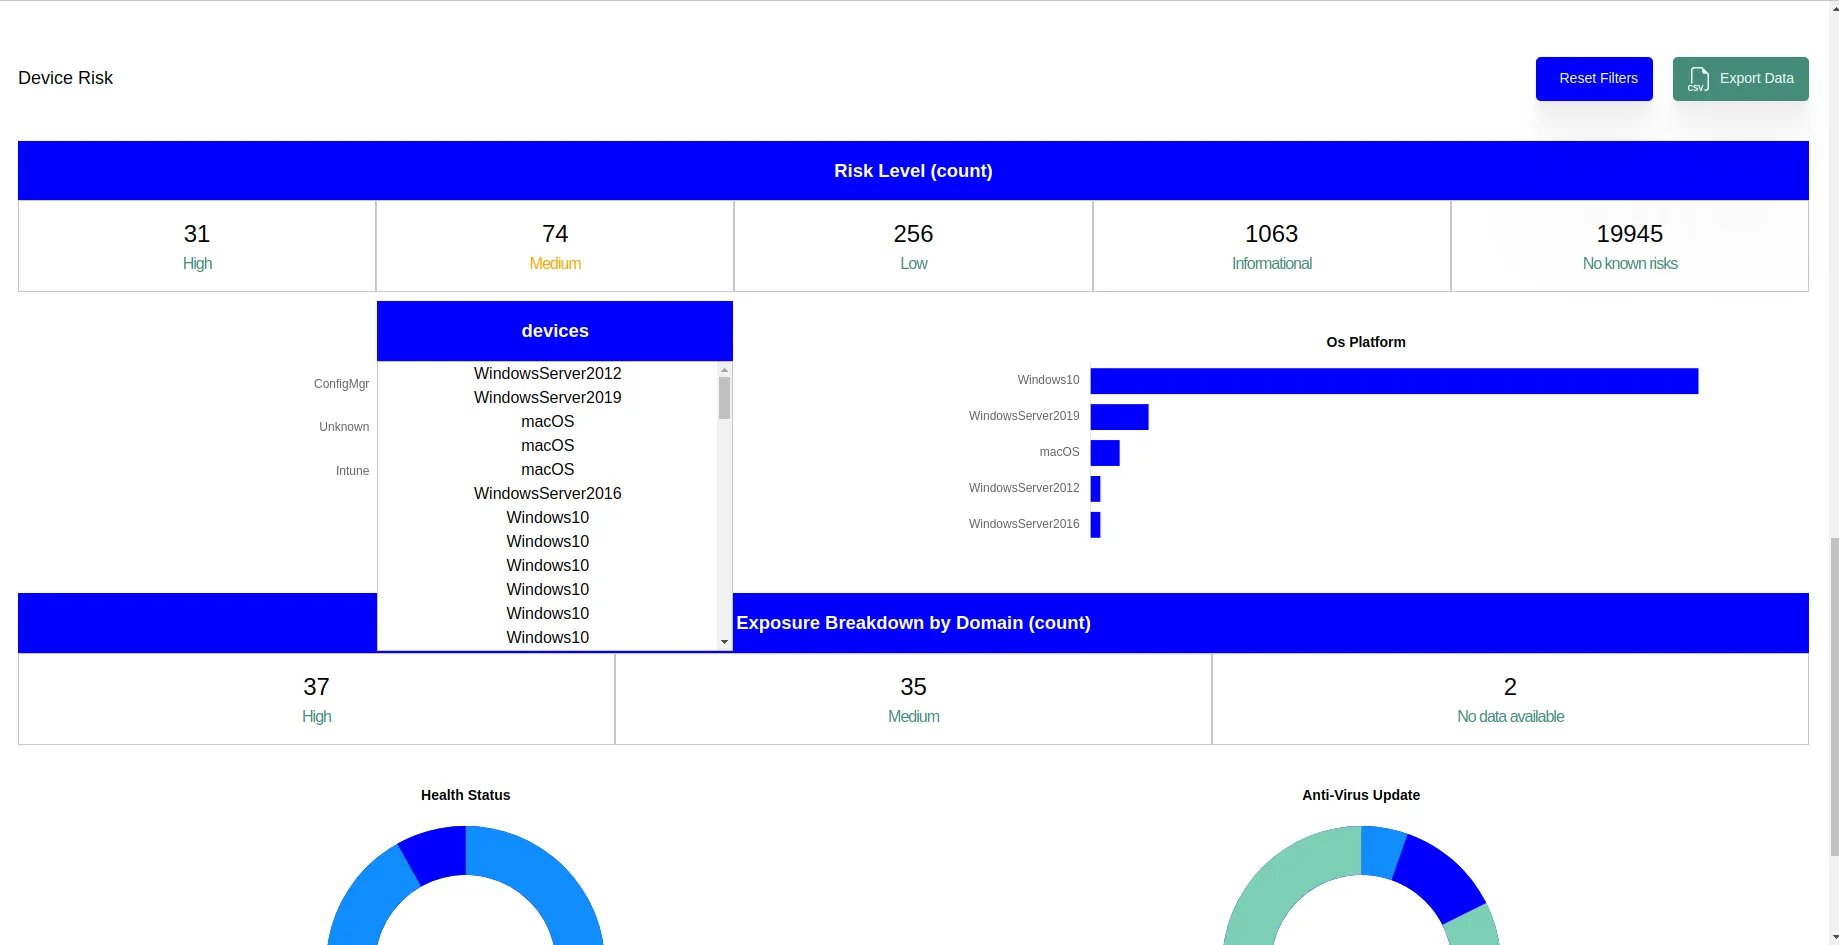
    By domain, risk, category

  6. 06

    Export report

    Generated client-side

06The hard problem

Large CSVs on the main thread without freezing the page

Secure Score exports from large tenants run to thousands of rows, and everything had to be parsed where the data was allowed to live: the browser. A naive synchronous parse locked the UI for seconds — unacceptable for the executive audience the tool served.

I chunked parsing so the main thread yields between batches, computed category aggregations incrementally as rows streamed in, and memoized the filter pipeline so toggling a domain re-ran only the affected slice instead of the whole dataset.

Filtering also exposed data-quality landmines: rows without color coding were silently inflating high-impact counts. Explicit exclusion rules — validated with BlueVoyant’s analysts — made the numbers match what Microsoft’s own console showed, which is what made the tool credible enough to put in front of enterprise customers.
07Impact
0
customer files stored — by architecture
190+
recommendations processed per report
hrs→min
report generation time
3
phased engagements from one deliverable
08Figures
FIG. 03 — ANALYTICS OVERVIEW
FIG. 03 — ANALYTICS OVERVIEWScore gauges and category breakdowns, computed in-browser.
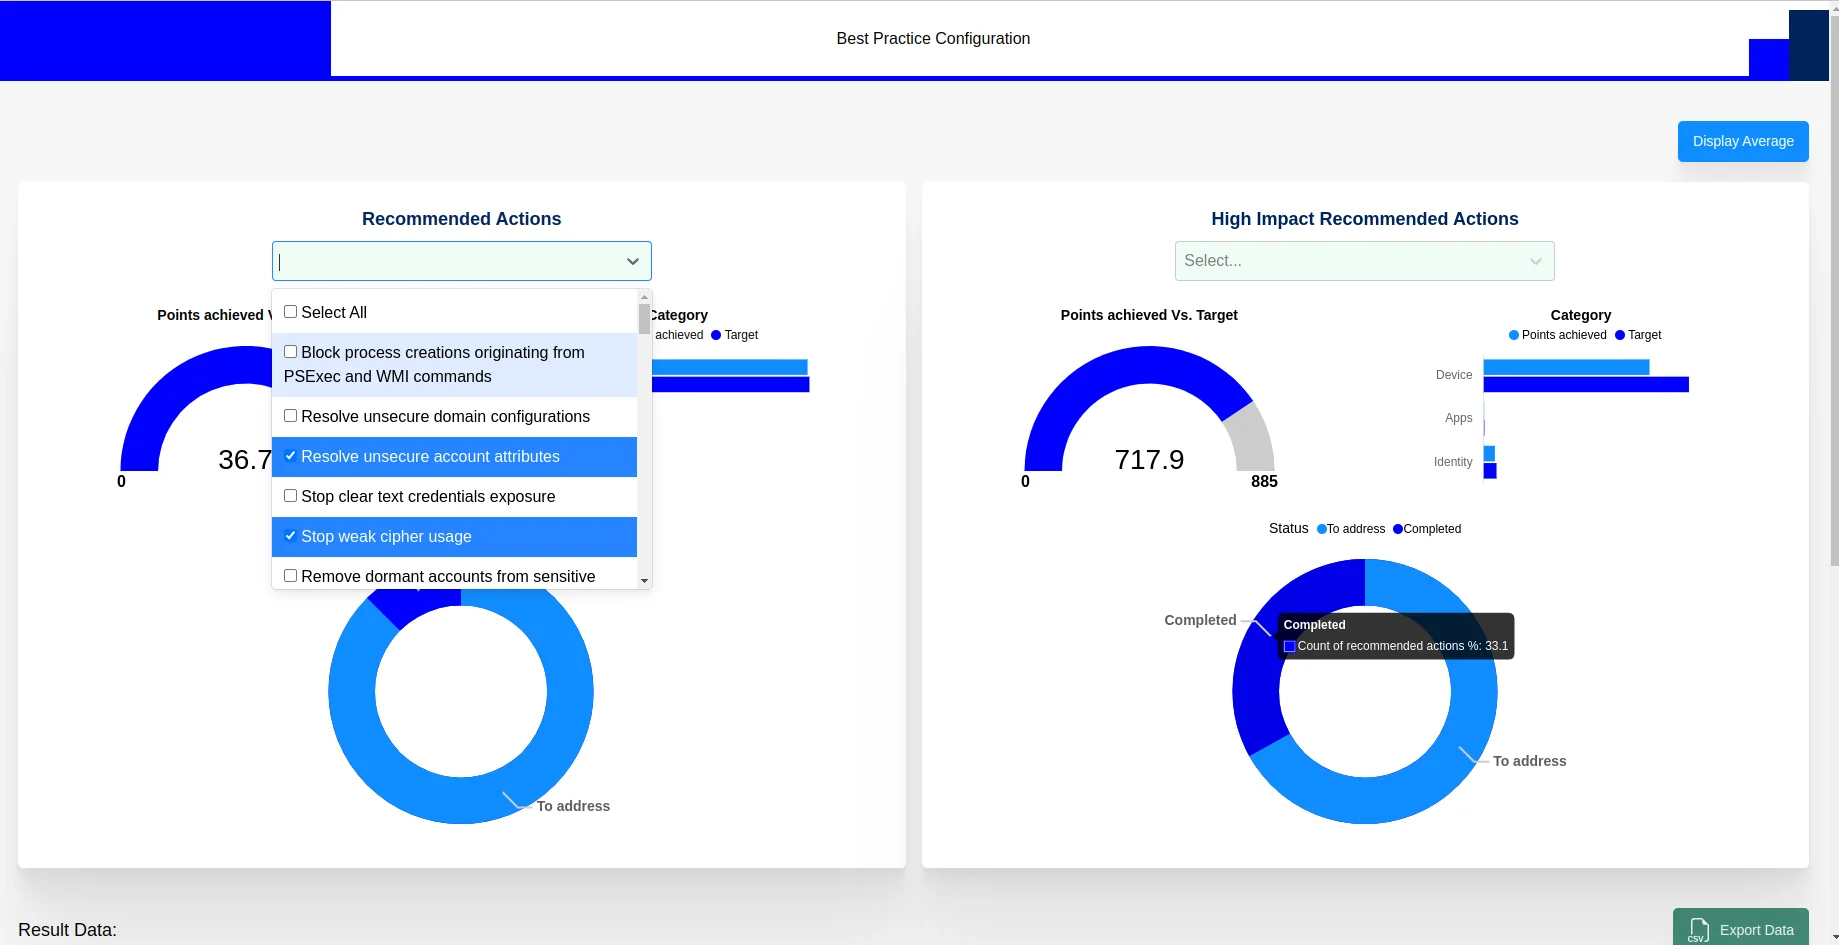
FIG. 04 — RECOMMENDED ACTIONS
FIG. 04 — RECOMMENDED ACTIONSDual-panel view: all recommendations vs high-impact subset.
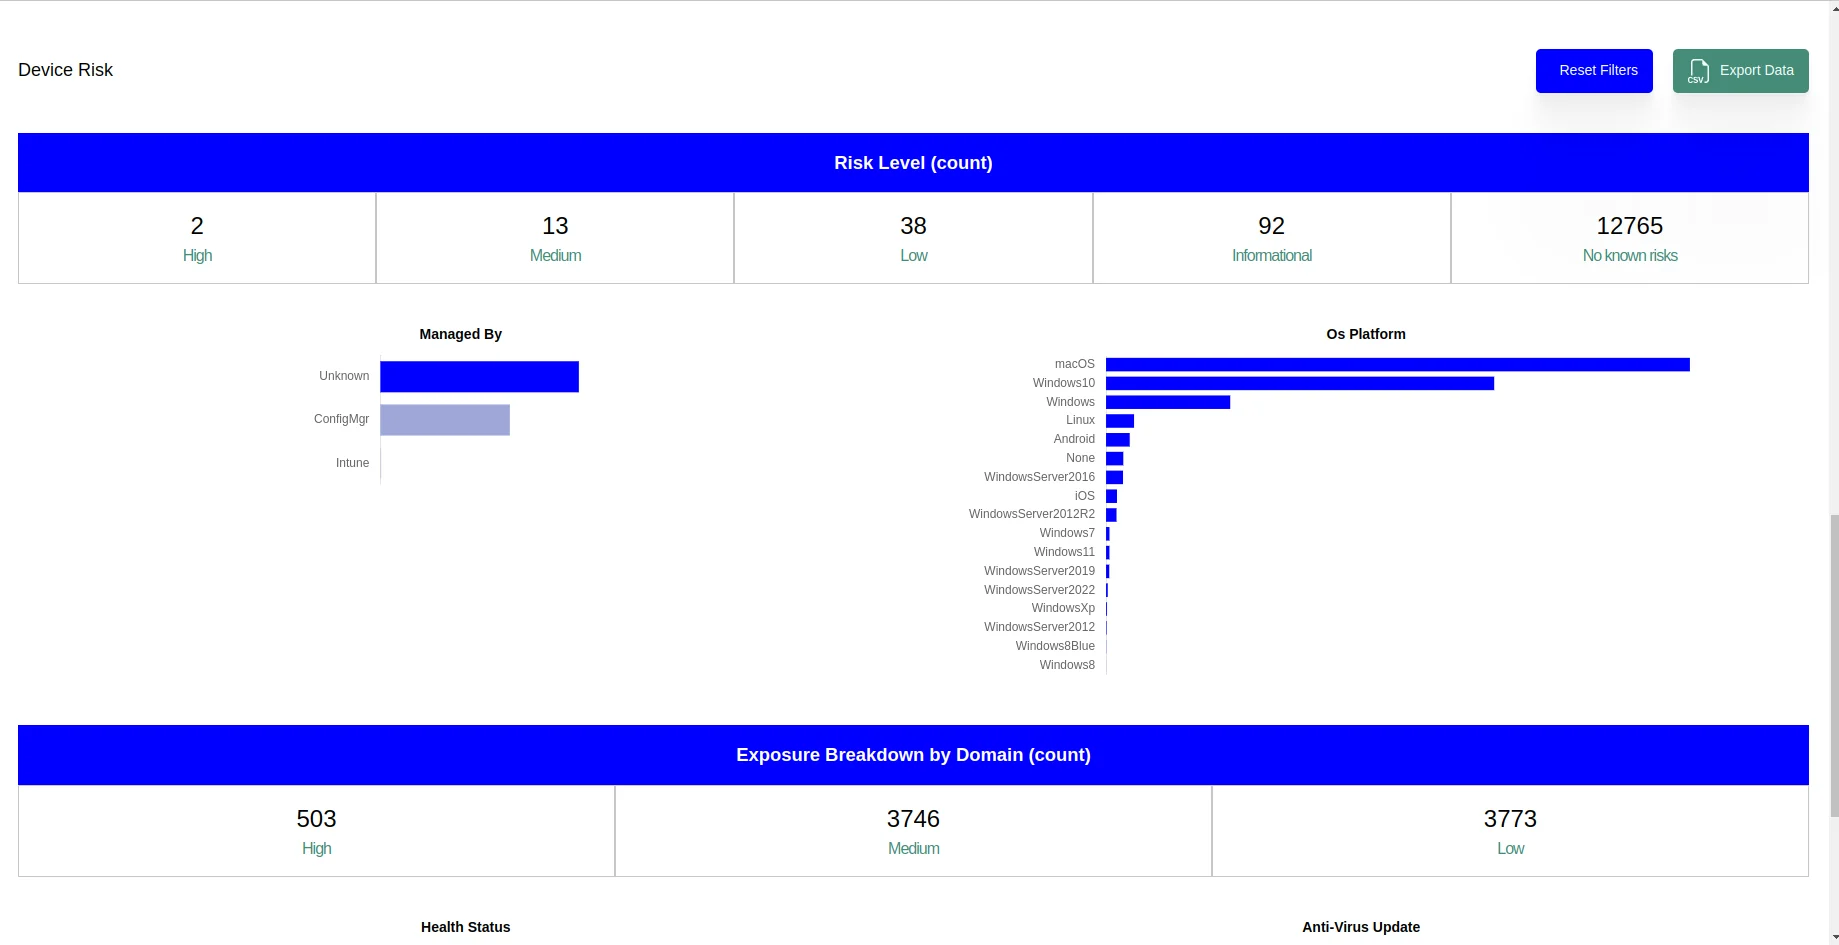
FIG. 05 — RISK ANALYSIS
FIG. 05 — RISK ANALYSISExposure by security domain and risk level.
FIG. 06 — FILTERING
FIG. 06 — FILTERINGMulti-select filters re-run only the affected data slice.